More information below 
The information you provide will be used in accordance with the terms of our Privacy Policy.


HOW IT WORKS
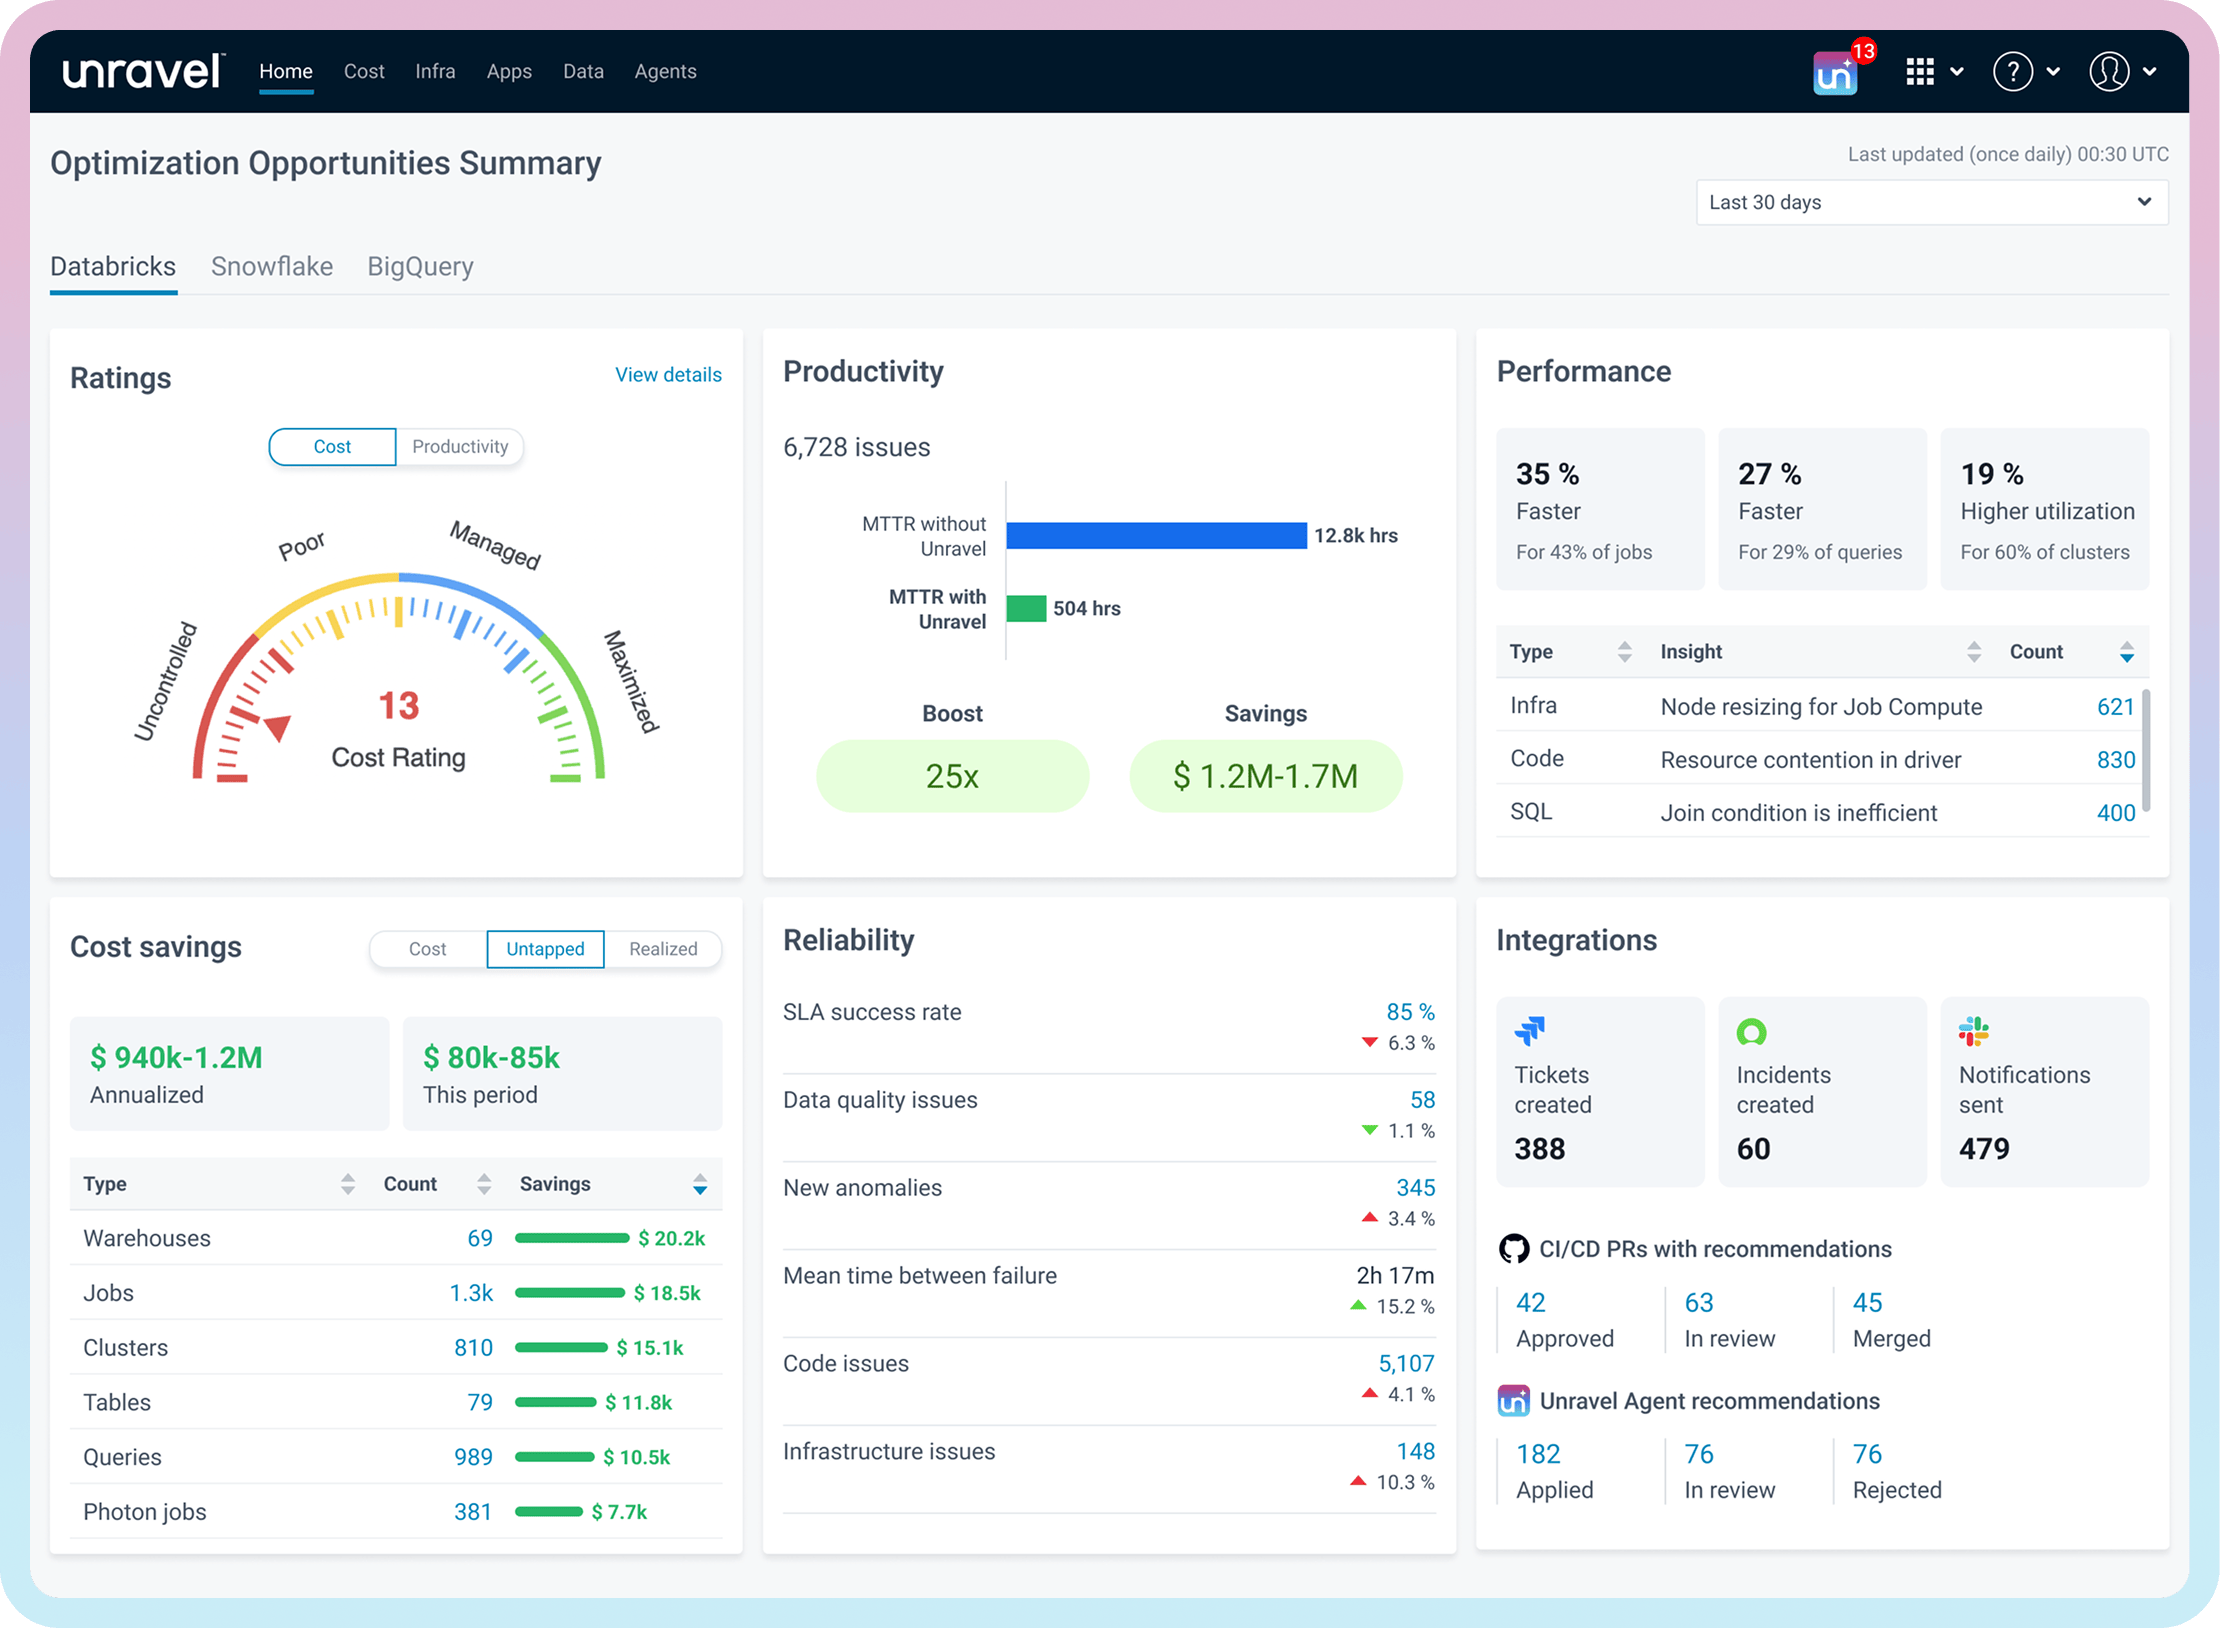

The overview page shows key areas of improvement and their expected impact. Insights are categorized under productivity, cost, and performance. Each category includes subcategories to help you drill down into potential improvements and see how to achieve them.
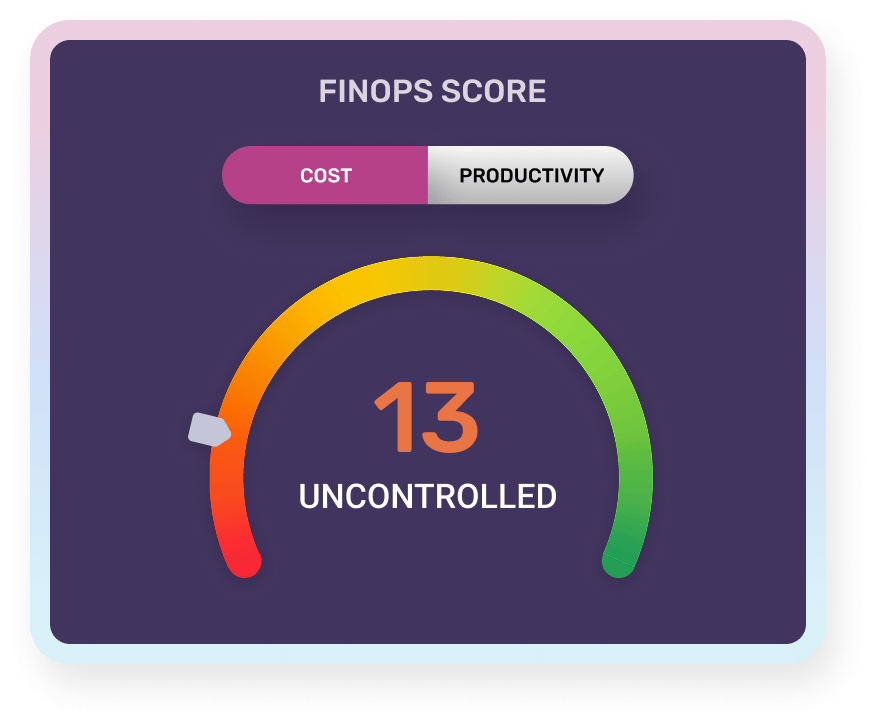

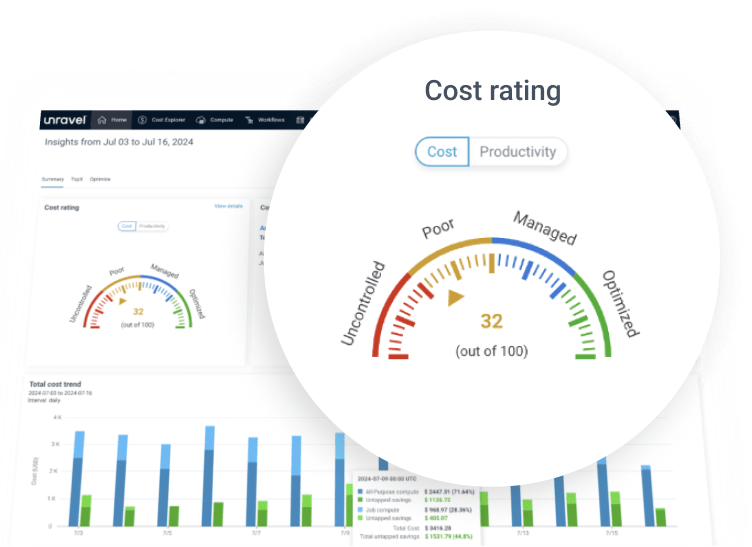
Unravel provides you a Databricks FinOps score or a cost efficiency rating. It then provides clarity on where to focus (jobs, data, users, infra) and what exactly to do in order to improve your Databricks cost. Underutilized clusters, poor code, data layout and more.
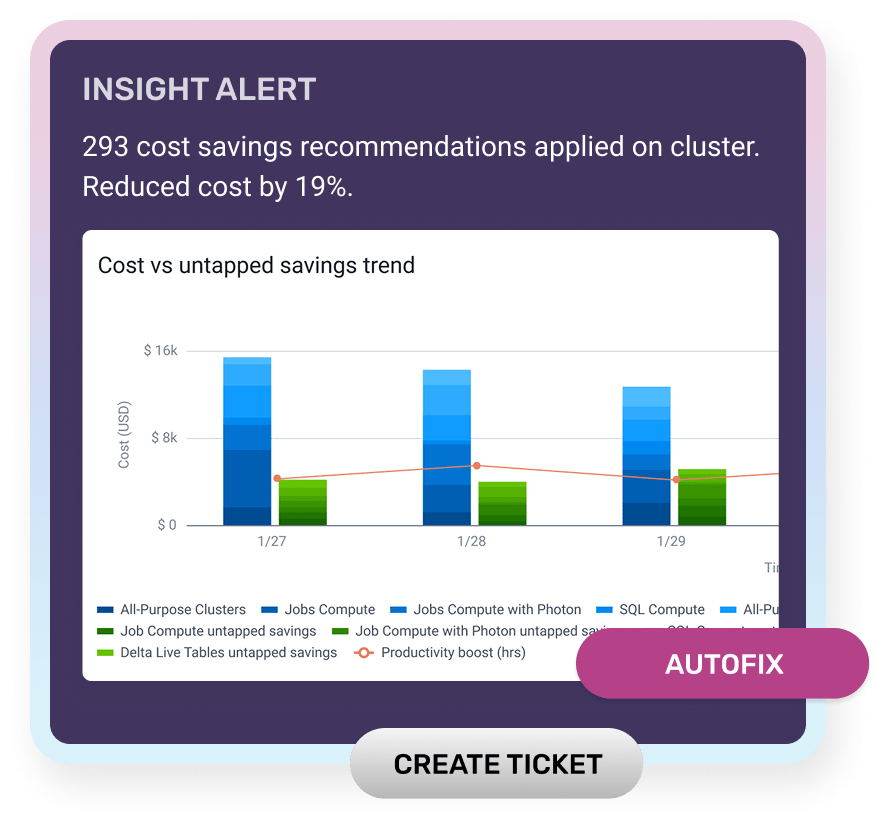

Unravel’s intelligence engine spots issues that are slowing down your jobs and workflows. It automatically pinpoints bottlenecks, errors, inefficiencies and gives you recommendations to solve these issues. Saving you time and effort, while guaranteeing performance SLAs.
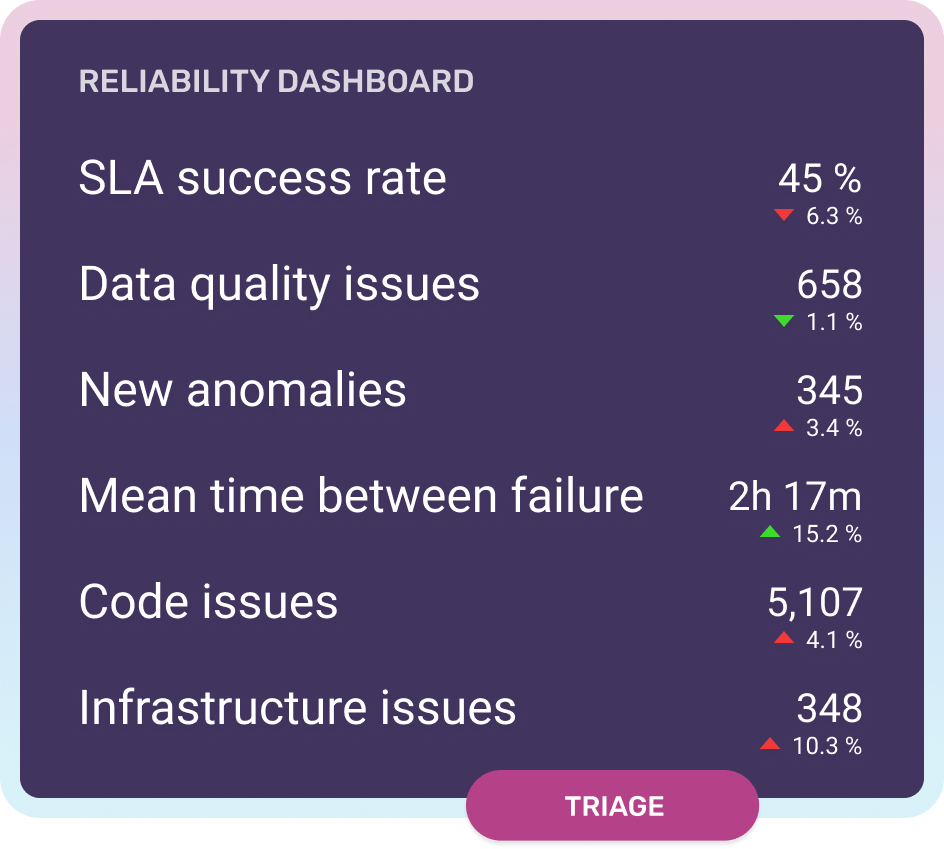

Unravel continuously monitors workflows, proactively identifies issues, and implements real-time fixes to prevent business operations from being affected. With AI-powered root cause analysis, detailed dependency mapping, and automated actionability, Unravel dramatically reduces troubleshooting time while maintaining consistent performance.


Unravel analyzes your account,jobs,, and table usage, correlated with additional Databricks telemetry to generate AI recommendations to improve performance, productivity, and cost efficiency. The Databricks Health Check report provides a summary of these details to help you prioritize next steps. Unravel is SOC 2-compliant, and has earned a Service Organization Control (SOC) 2, Type II certification.
The Databricks Health Check includes recommendations to improve performance, productivity, and cost efficiency. For example, if a job is running on a cluster that is under-utilized, Unravel’s AI recommendations may suggest right-sizing that cluster for more efficient processing.
Yes, in order to produce a Databricks Health Check, you will need to securely connect Databricks telemetry. Once the report is ready, you will receive a copy in your inbox that is yours to review and share with your team.
Once you request your Databricks Health Check, our team will share instructions to securely connect to your telemetry. Once telemetry is connected, your report is typically delivered in about 2-3 business days.
Since your Databricks environment is dynamic, it is recommended to choose a regular update cadence that can reflect changes you make to your code, clusters, tables, and jobs. If you would like frequent updates, Unravel can be configured for near real-time reporting.
Learn more about these options in our docs here.