Snowflake’s data cloud has expanded to become a top choice among organizations looking to leverage data and AI—including large language models (LLMs) and other types of generative AI—to deliver innovative new products to end users and customers. However, the democratization of AI often leads to inefficient usage that results in a cost explosion and decreases the business value of Snowflake. The inefficient usage of Snowflake can occur at various levels. Below are just some examples.
- Warehouses: A warehouse that is too large or has too many clusters for a given workload will be underutilized and incur a higher cost than necessary, whereas the opposite (the warehouse being too small or having too few clusters) will not do the work fast enough.
- Workload: The democratization of AI results in a rapidly increasing number of SQL users, many of whom focus on getting value out of the data and do not think about the performance and the cost aspects of running SQL on Snowflake. This often leads to costly practices such as:
- SELECT * just to check out the schema
- Running a long, timed-out query repeatedly without checking why it timed out
- Expensive joins such as cartesian products
- Data: No or poorly chosen cluster or partition keys lead to many table scans. Unused tables accumulate over time and by the time users notice the data explosion, they have a hard time knowing which tables may be deleted safely.
Snowflake, like other leading cloud data platforms, provides various compute options and automated features to help with the control of resource usage and spending. However, you need to understand the characteristics of your workload and other KPIs, and have domain expertise, to pick the right options and settings for these features—not to mention there’s no native support to identify bad practices and anti-patterns in SQL. Lastly, optimization is not a one-time exercise. As business needs evolve, so do workloads and data; optimizing for cost and performance becomes part of a continued governance of data and AI operations.
Introducing Unravel for Snowflake
Unravel for Snowflake is a purpose-built AI-driven data observability and FinOps solution that enables organizations to get maximum business value from Snowflake by achieving high cost efficiency and performance. It does so by providing deep, correlated visibility into cost, workload, and performance, with AI-powered insights and automated guardrails for continued optimization and governance. Expanding the existing portfolio of purpose-built AI solutions for Databricks, BigQuery, Amazon EMR, and Cloudera, Unravel for Snowflake is the latest data observability and FinOps product from Unravel Data.
The new Unravel for Snowflake features align with the FinOps phases of inform, optimize, operate:
INFORM
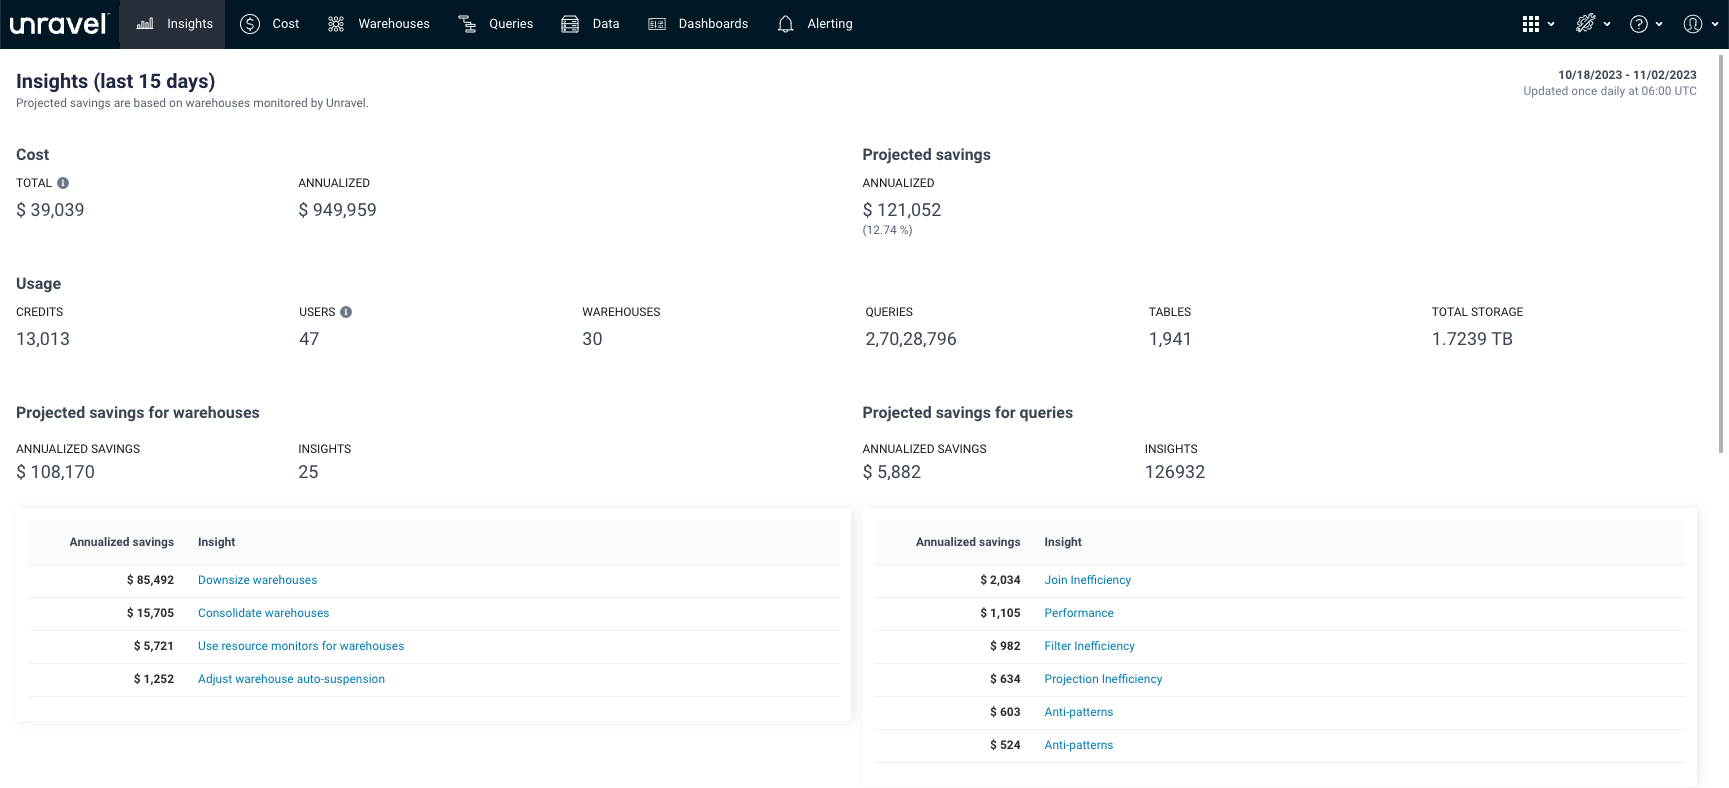
- A “Health Check” that provides a top-down summary view of cost, usage, insights to improve inefficiencies, and projected annualized savings from applying these insights
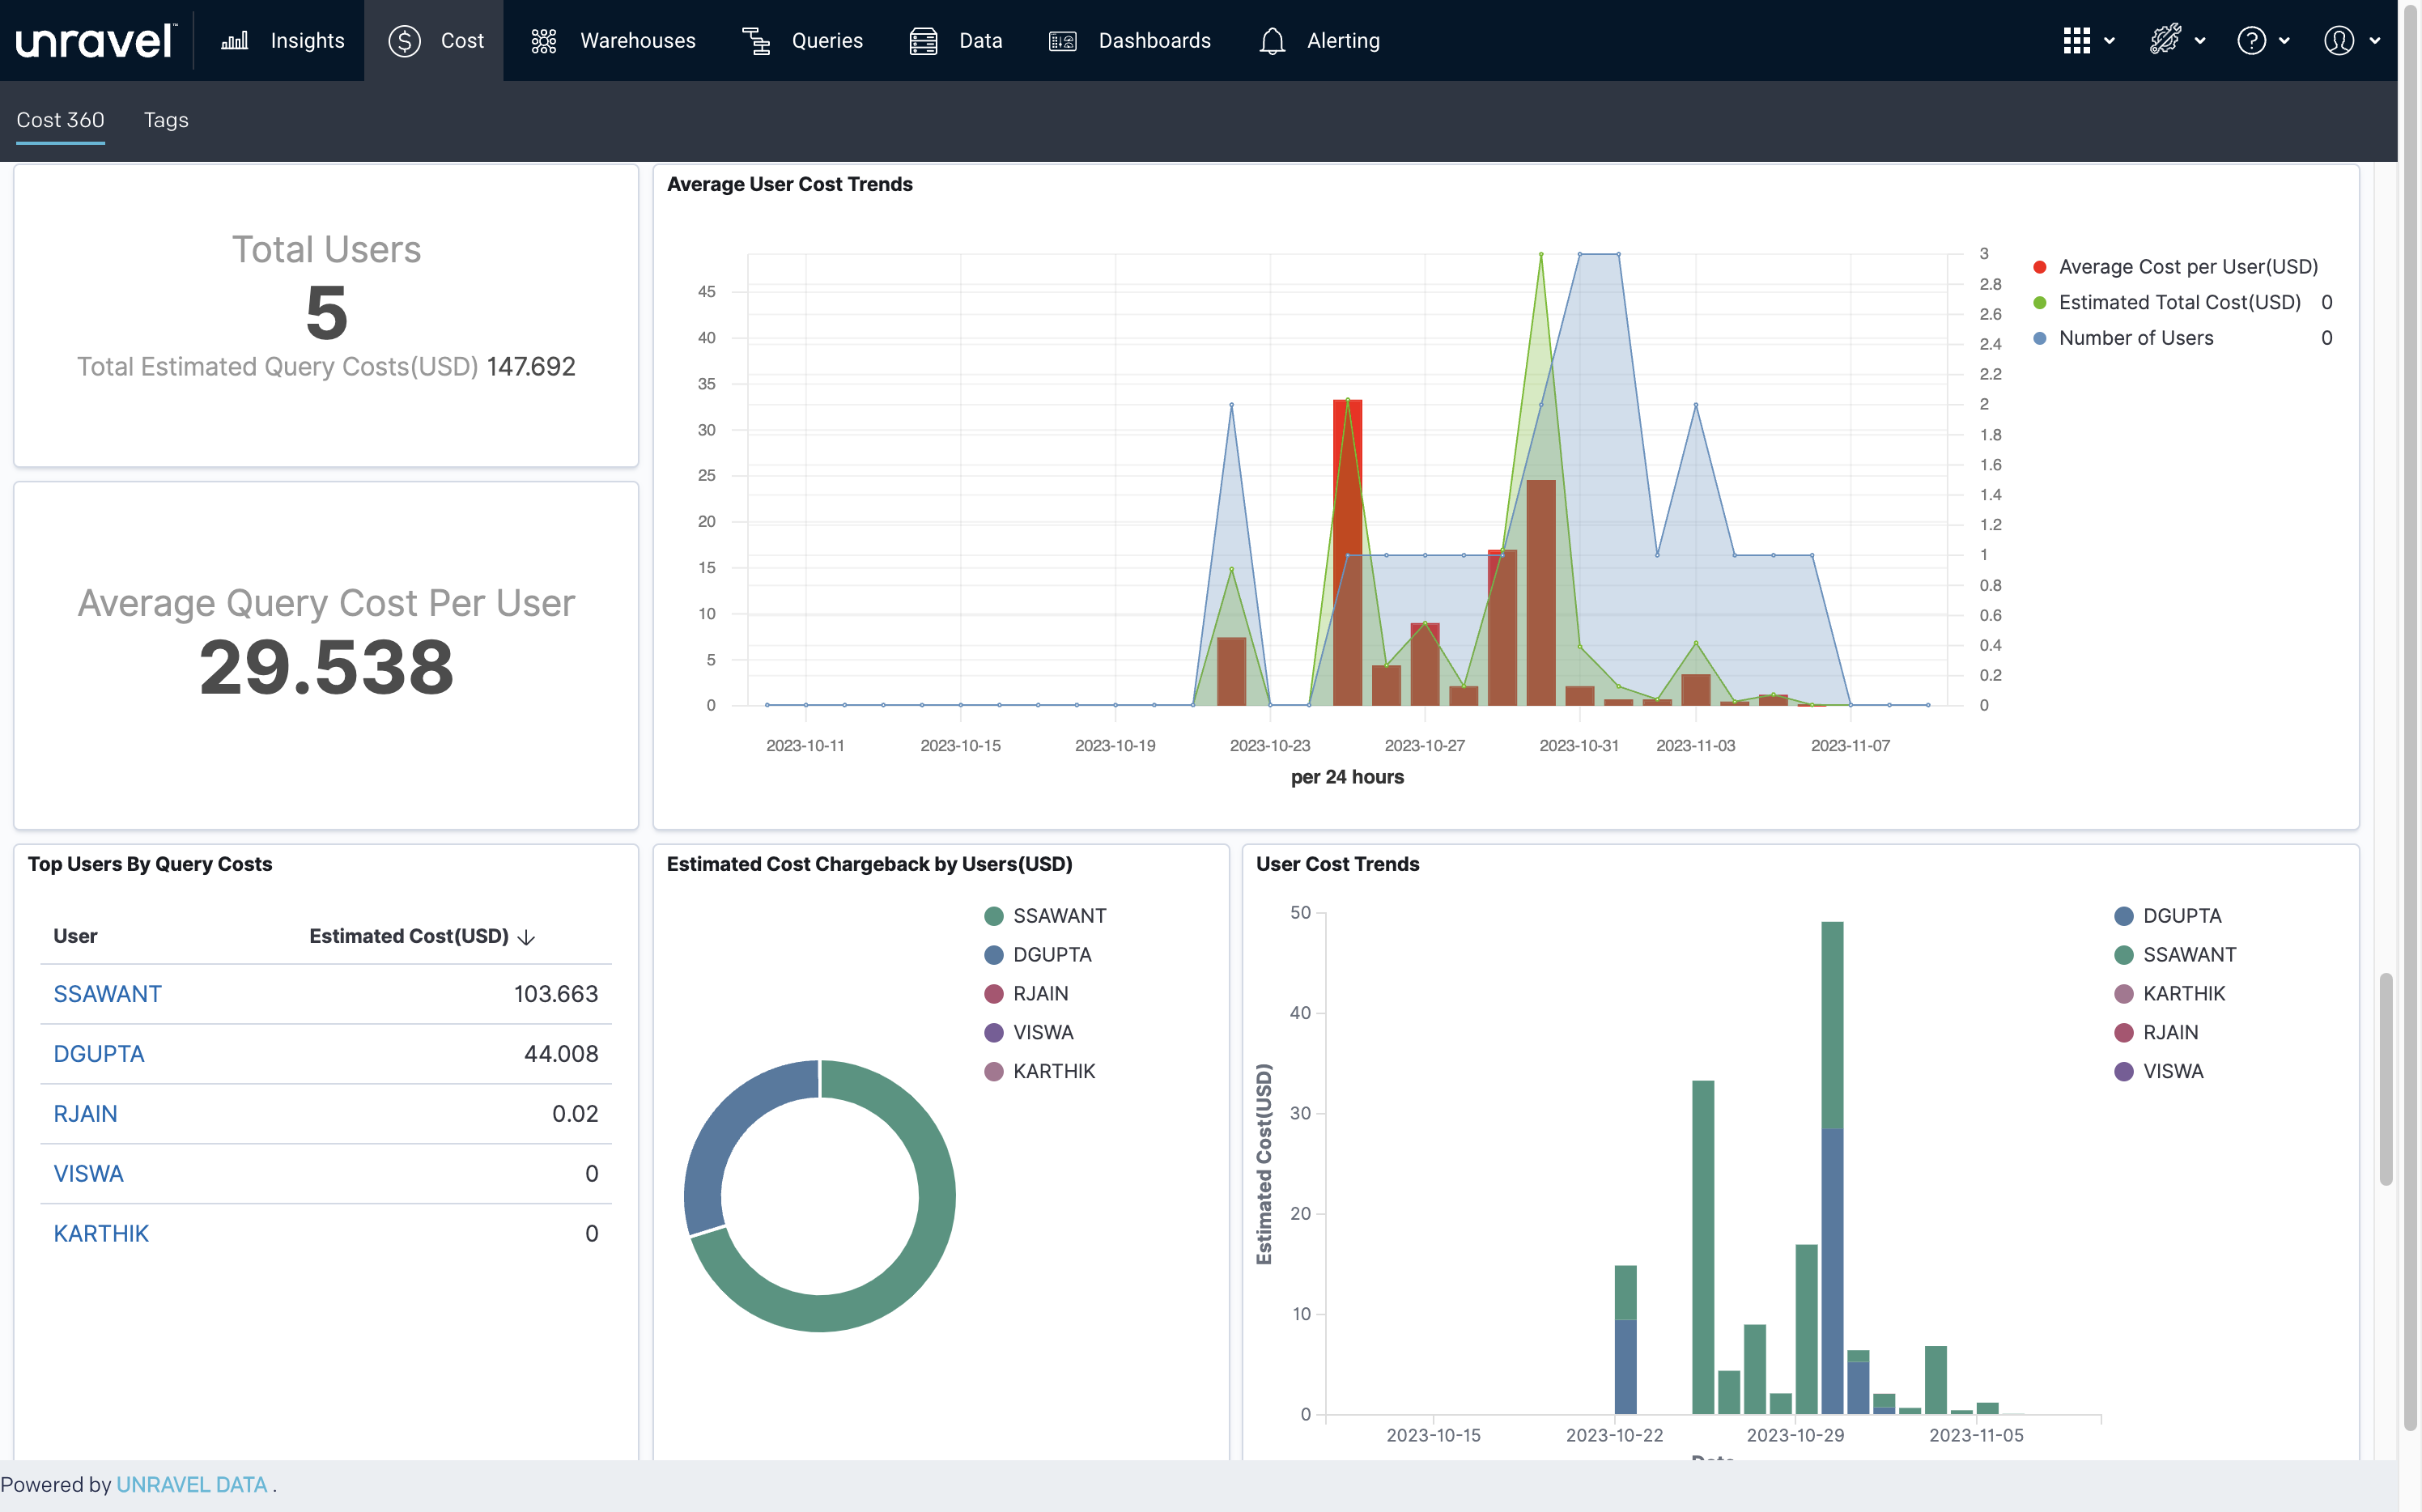
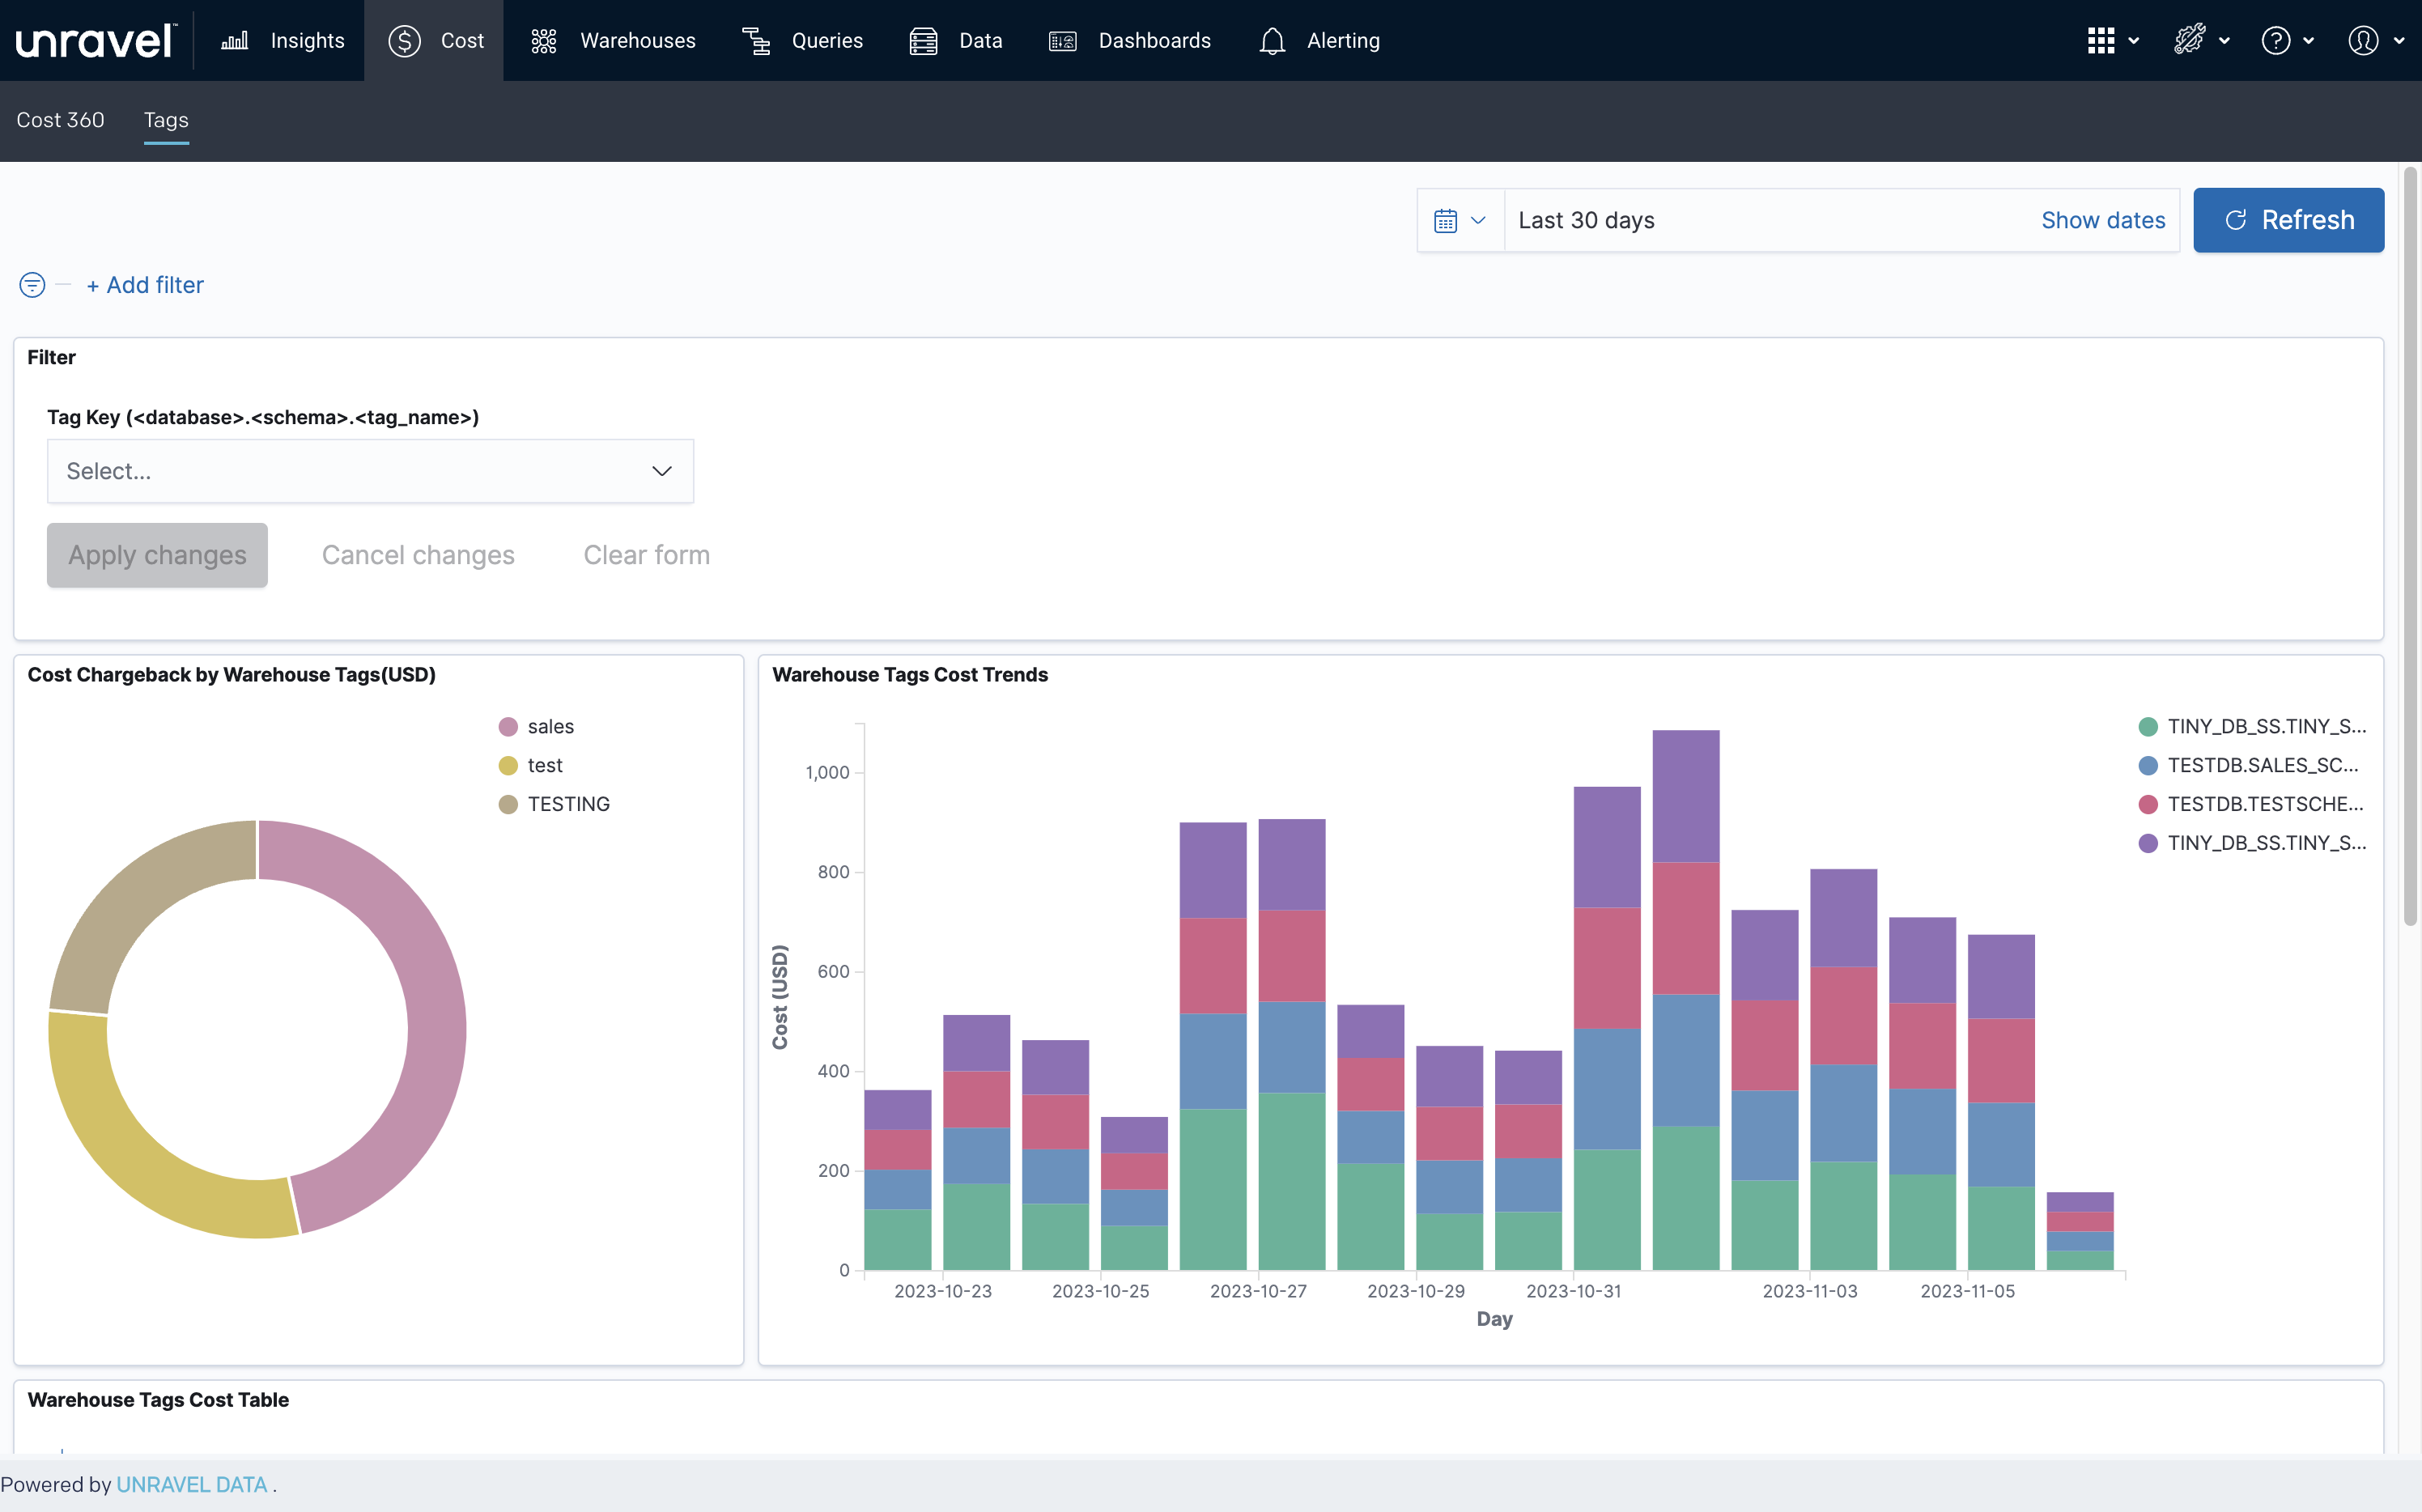
- A Cost 360 view that captures complete cost across compute, storage and data transfer, and shows chargeback and trends of cost and usage across warehouses, users, tags, and queries
- Top K most expensive warehouses, users, queries
- Detailed warehouse and query views with extensive KPIs
- Side-by-side comparison of queries
OPTIMIZE
- Warehouse insights
- SQL insights
- Data and storage insights
OPERATE
- OpenSearch-based alerts on query duration and credits
- Alert customization: ability to create custom alerts
Let us first take a look at the Health Check feature that kick-starts the journey of cost and performance optimization.
Health Check for Cost and Performance Inefficiencies
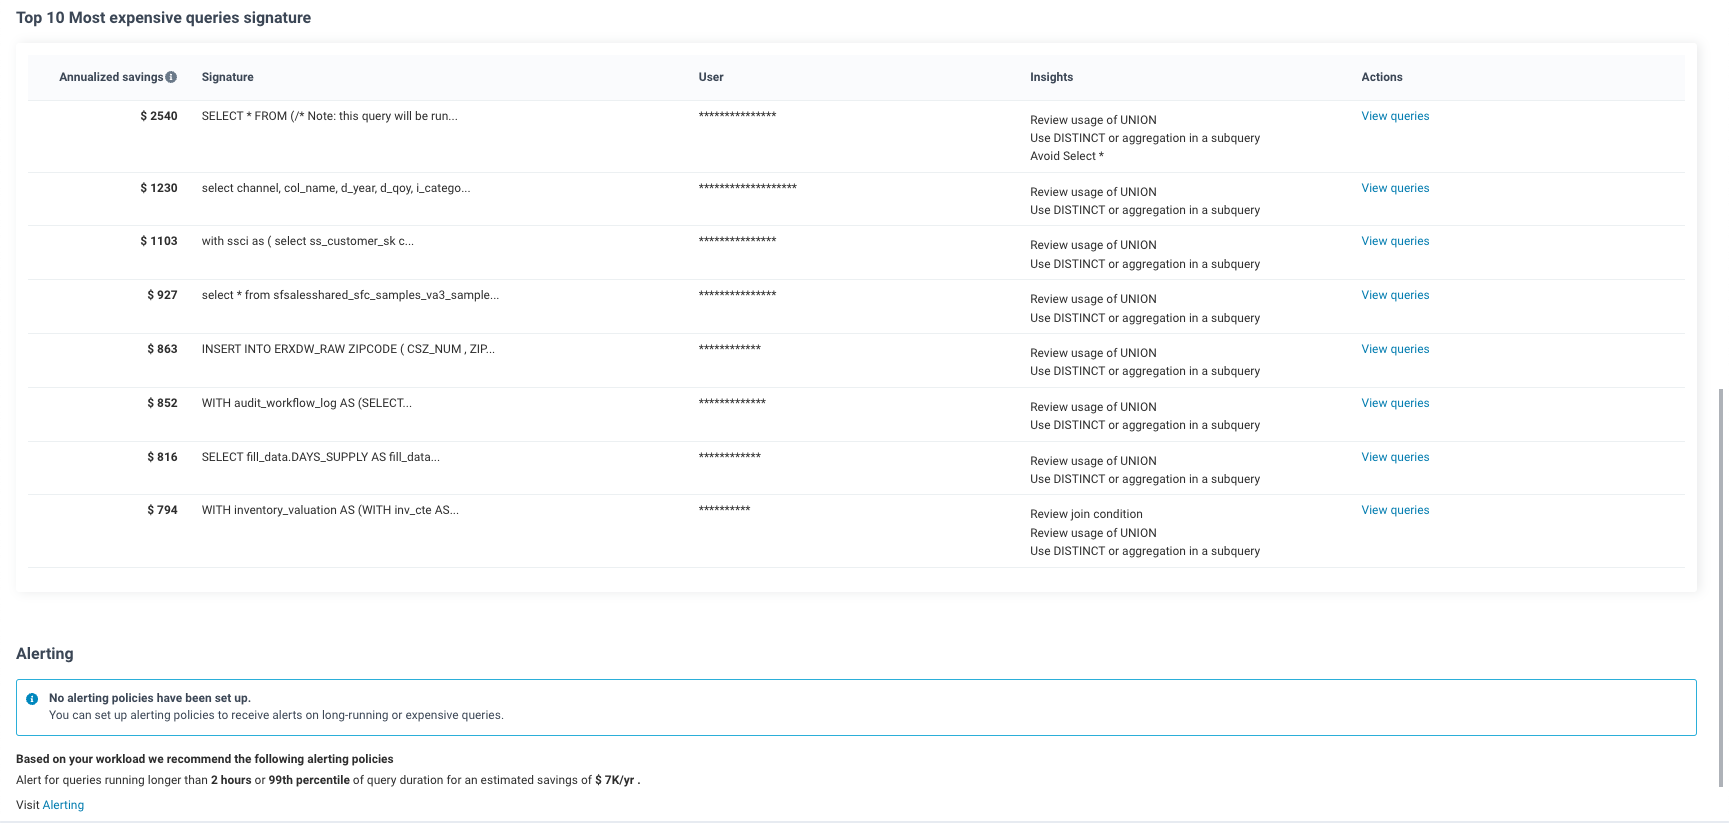
The Health Check feature automatically analyzes the workload and cost over the past 15 days. It generates a top-down summary of the cost and usage during this period and, more important, shows insights to improve the inefficiencies for cost and performance—along with the projected annualized savings from applying these insights.
Users can easily spot the most impactful insights at the warehouse and query levels, and drill down to find out the details. They can also view the top 10 most expensive “query signatures,” or groups of similar queries. Lastly, it recommends alerting policies specific to your workload.
Users can use the Health Check feature regularly to find new insights and their impact in savings. As the workloads evolve with new business use cases, new inefficiencies may arise and require continued monitoring and governance.
Request report here
Digging Deep into Understanding Spending
Unravel also enables you to easily visualize and understand where money is spent and whether there are anomalies that you should investigate. The Cost 360 view provides cost breakdown and trends across warehouses, users, queries, and tags. It also shows top offenders by listing the most expensive warehouses, users, and query signatures, so that users can address them first.
Debugging and Optimizing Failed, Costly, and Slow Queries
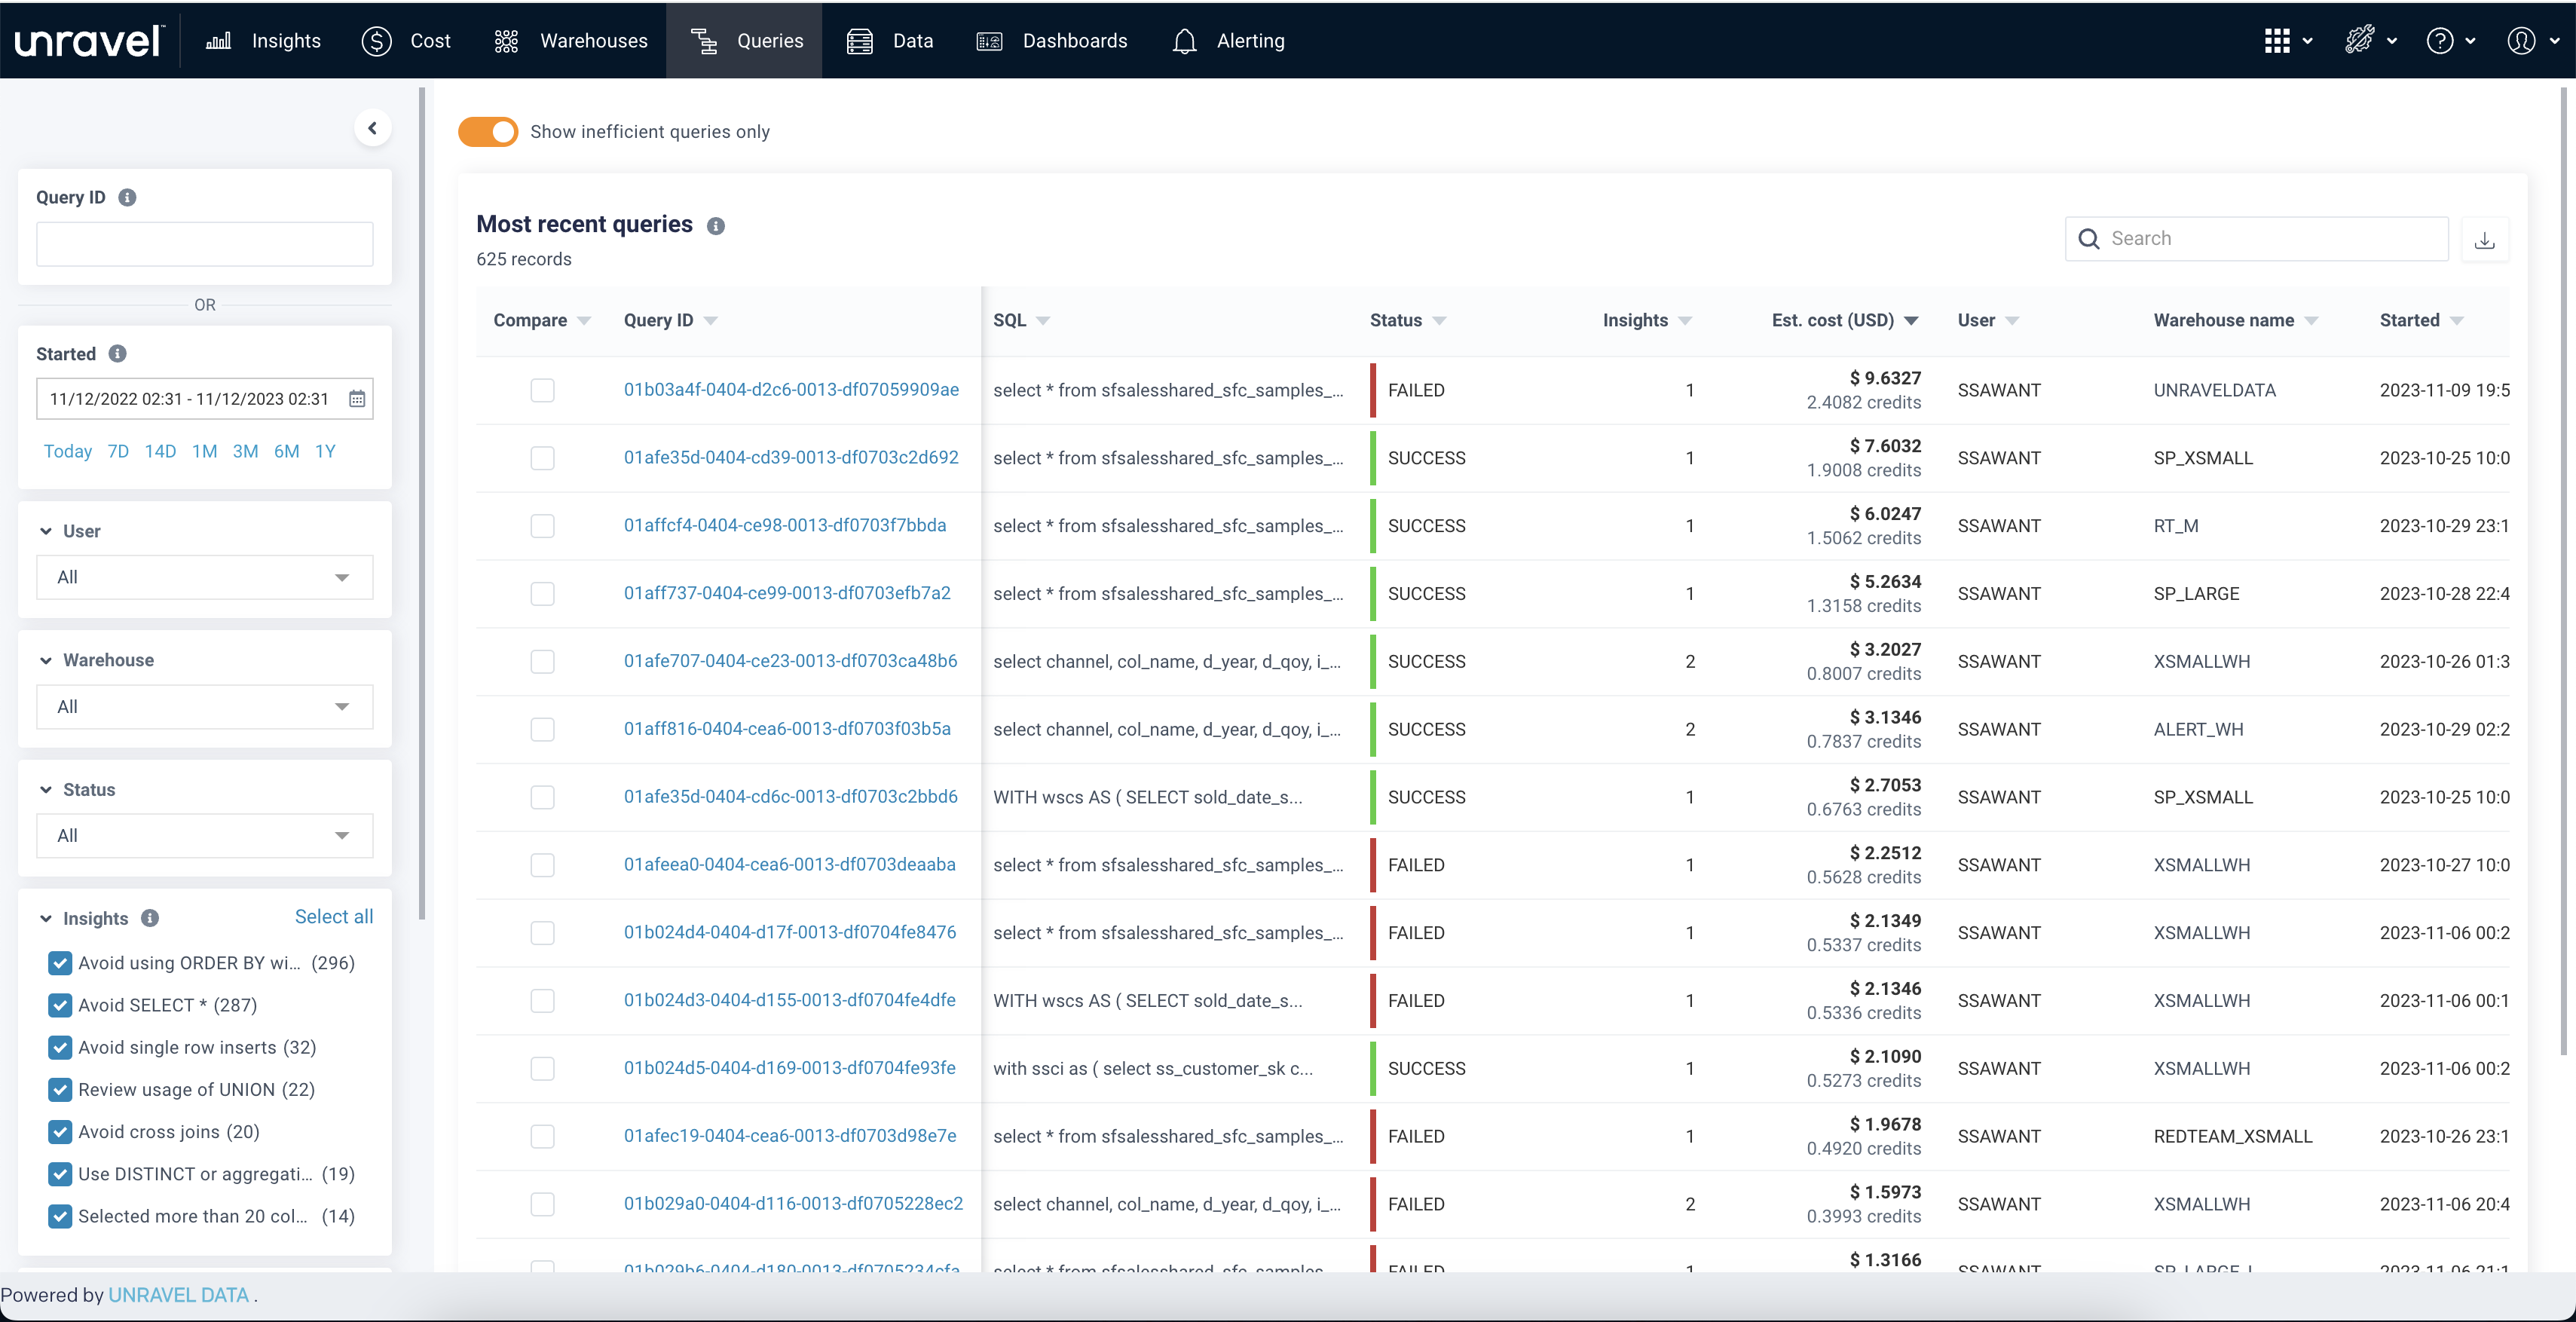
Unravel captures extensive data and metadata about cost, workload, and data, and automatically applies AI to generate insights and recommendations for each query and warehouse. Users can filter queries based on status, insights, duration, etc., to find interesting queries, and drill down to look at query details, including the insights for cost and performance optimization. They can also see similar queries to a given query and do side-by-side comparison to spot the difference between two runs.
Get Started with Unravel for Snowflake
To conclude, Unravel supports a variety of use cases in FinOps, from understanding cost and usage, to optimizing inefficiencies and providing alerts for governance. Learn more about Unravel for Snowflake by reading the Unravel for Snowflake docs and request a personalized Snowflake Health Check report.
Role | Scenario | Unravel benefits |
FinOps Practitioner | Understand what we pay for Snowflake down to the user/app level in real time, accurately forecast future spend with confidence | Granular visibility at the warehouse, query, and user level enables FinOps practitioners to perform cost allocation, estimate annual data cloud application costs, cost drivers, break-even, and ROI analysis. |
FinOps Practitioner / Engineering / Operations | Identify the most impactful recommendations to optimize overall cost and performance | AI-powered performance and cost optimization recommendations enable FinOps and data teams to rapidly upskill team members, implement cost efficiency SLAs, and optimize Snowflake pricing tier usage to maximize the company’s cloud data ROI. |
Engineering Lead / Product Owner | Identify the most impactful recommendations to optimize the cost and performance of a warehouse | AI-driven insights and recommendations enable product and data teams to improve slot utilization, boost SQL query performance, leverage table partitioning and column clustering to achieve cost efficiency SLAs and launch more data queries within the same warehouse budget. |
Engineering / Operations | Live monitoring with alerts | Live monitoring with alerts speed mean time to repair (MTTR) and prevent outages before they happen. |
Data Engineer | Debugging a query and comparing queries | Automatic troubleshooting guides data teams directly to the pinpoint the source of query failures down to the line of code or SQL query along with AI recommendations to fix it and prevent future issues. |
Data Engineer | Identify expensive, inefficient, or failed queries | Proactively improve cost efficiency, performance, and reliability before deploying queries into production. Compare two queries side-by-side to find any metrics that are different between the two runs, even if the queries are different. |
Other Useful Links
- Our platform for Snowflake Optimization
- Get a Free Snowflake Health Check
- Check out other Snowflake Resources


