

Architecting Automated Performance Management (APM) Solution
In the last APM blog, we broke down the modern data stack, reviewed some of the stack’s biggest operational challenges, and explained what’s required for a performance management solution to meet those needs. In this piece, we’ll dive deeper in discussing the features that solutions should offer in order to support modern data stacks comprised of multiple distributed systems. Specifically, we’ll look at two of the main components these solutions should deliver: diagnosing application failures and optimizing clusters.
Application Failures
Apps break down for many different reasons, particularly in highly distributed environments. Traditionally, it’s up to the users to identify and fix the cause of the failure and get the app running smoothly again. Applications in distributed systems are comprised of many components, resulting in lots of raw logs appearing when failure occurs. With thousands of messages, including errors and stack traces, these logs are highly complex and can be impossible for most users to comb through. It’s incredibly difficult and time-consuming even for experts to discover the root cause of app failure through all of this noise. To generate insights into a failed application in a multi-engine modern data stack, a performance management solution needs to deliver the following:
- Automatic identification of the root cause of application failure: This is one of the most important tools to mitigate challenges. The solution should continuously collect logs from a variety of application failures, convert those logs into feature vectors, then learn a predictive model for root cause analysis (RCA) from these feature vectors. Figure X1 shows a complete solution to deal with such problems and automate RCA for application failures.
- Data collection for training: We all know the chief axiom of analytics: garbage in, garbage out. With this principle in mind, RCA models must be trained on representative input data. For example, if you’re performing RCA on a Spark failure, it’s imperative that the solution has been trained on log data from actual Spark failures across many different deployments.
- Accurate model prediction: ML techniques for prediction can be classified as supervised learning and unsupervised learning. We use both in our solutions. We attach root-cause labels with the logs collected from an application failure. Labels come from a taxonomy of root causes as the one illustrated in Figure X2. Once the logs are available, we can construct feature vectors, using for example, the Doc2Vec technique that uses a three-layer neural network to gauge the context of the document and related similar content together. After the feature vectors are generated along with a label, we can apply a variety of learning techniques for automatic RCA, such as shallow as well as deep learning techniques, including random forests, support vector machines, Bayesian classifiers, and neural networks. Example results produced by our solution are shown in Figure X3.
- Automatic fixes for failed applications: This capability uses an algorithm to automatically find and implement solutions to failing apps. This algorithm is based on data from both successful and failed runs of a given app. Providing automatic fixes is one of the most critical features of a performance management solution as it saves users the time and headache of manually troubleshooting broken apps. Figure X4 shows an automated tuning process of a failed Spark application.
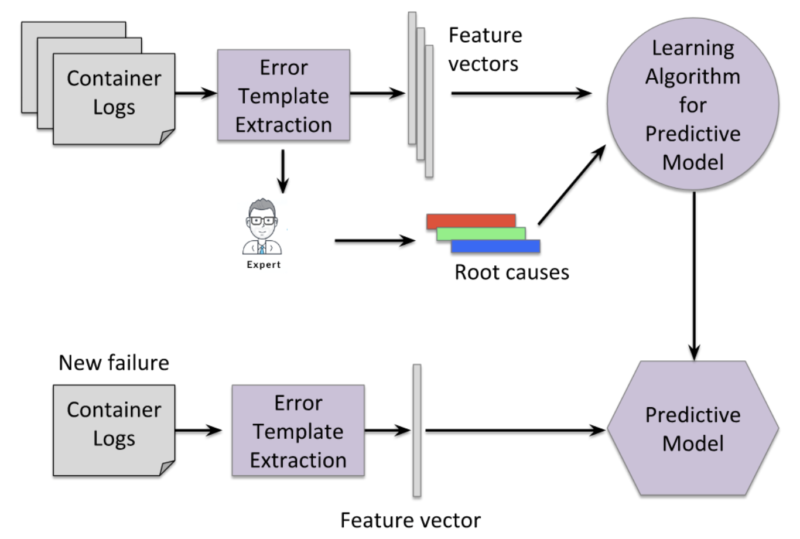
Figure X1: Approach for automatic root cause analysis
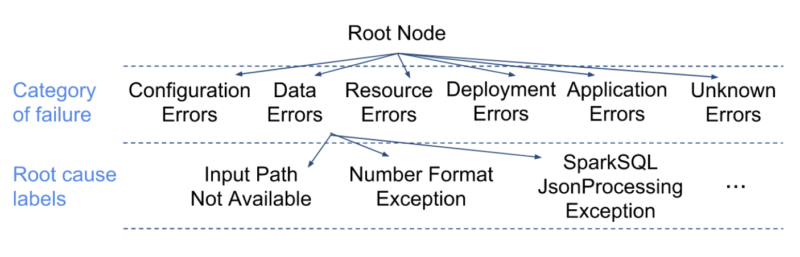
Figure X2: Taxonomy of failures
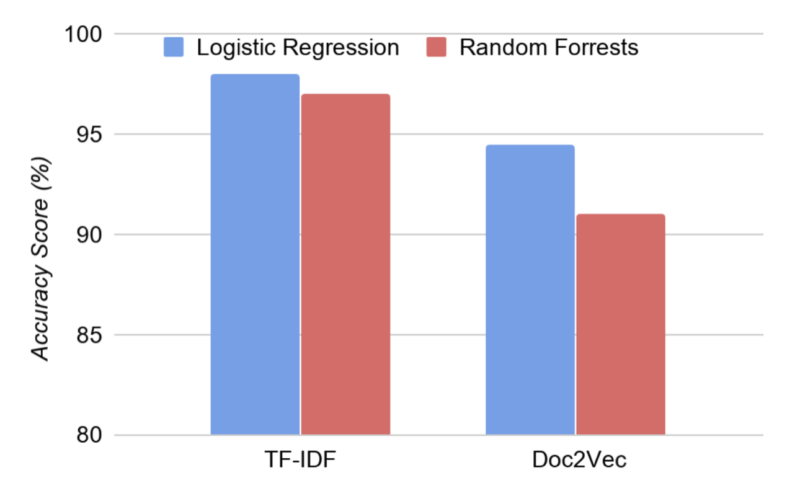
Figure X3: Feature vector generation
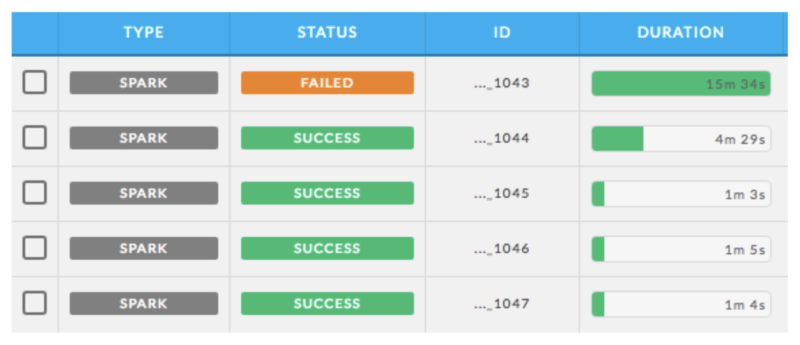
Figure X4: Automated tuning of a failed Spark application
Cluster Optimization
In addition to understanding app failures, the other key component of an effective big data performance management solution is cluster optimization. This includes performance management, autoscaling, and cost optimization. When properly delivered, these objectives benefit both IT operations and DevOps teams. However, when dealing with distributed big data, it’s not easy to execute cluster-level workload analysis and optimization. Here’s what we need to do:
- Operational insights: This refers to the analysis of metrics data to yield actionable insights. This includes insights on app performance issues (i.e., whether a failure is due to bad code or resource contention), insights on cluster tuning based on aggregation of app data (i.e., finding out whether a compute cluster is properly tuned at both a cluster and application level), and insights on cluster utilization, cloud usage, and autoscaling. We also provide users with tools to help them understand how they are using their compute resources, as for example, compare cluster activity between two time periods, aggregated cluster workload, summary reports for cluster usage, chargeback reports, and so on. In addition to that, we also provide cluster level recommendations to fine tune cluster wide parameters to maximize a cluster’s efficiency based upon the cluster’s typical workload. To do so, we (a) collect performance data of prior completed applications, (b) analyze the applications w.r.t. the cluster’s current configuration, (c) generate recommended cluster parameter changes, and (d) predict and quantify the impact that these changes will have on applications that will execute in the future. Figure Y1 shows example recommendations for tuning the size of map containers (top) and reduce containers (bottom) on a production cluster, and in particular the allocated memory in MB.
- Workload analysis: This takes a closer look at queue usage to provide a holistic picture of how apps run and how they affect one another on a set of clusters. Workload analysis highlights usage trends, sub-optimal queue designs, workloads that run sub-optimally on queues, convoys, slow apps, problem users (e.g., users who frequently run applications that reach max capacity for a long period), and queue usage per application type or user project. Figure Y2 shows example resource utilization charts for two queues over a time range. In one queue, the workload running does not use all the resources allocated, whilst the workload in the other queue needs more resources. In this figure, the purple line shows resource request and the black line shows resource allocation. Based on such findings, we generate queue level insights and recommendations including queue design/settings modifications (e.g., change resource budget for a queue or max/min limits), workload reassignment to different queues (e.g., move an application or a workload from one queue to another), queue usage forecasting, etc. A typical big data deployment involves 100s of queues and without automation such task can be tedious.
- Forecasting: Forecasting leverages historical operational and application metrics to determine future needs for provisioning, usage, cost, job scheduling, and other attributes. This is important for capacity planning. Figure Y3 shows an example disk capacity forecasting chart; the black line shows actual utilization and the light blue line shows a forecast within an error bound.
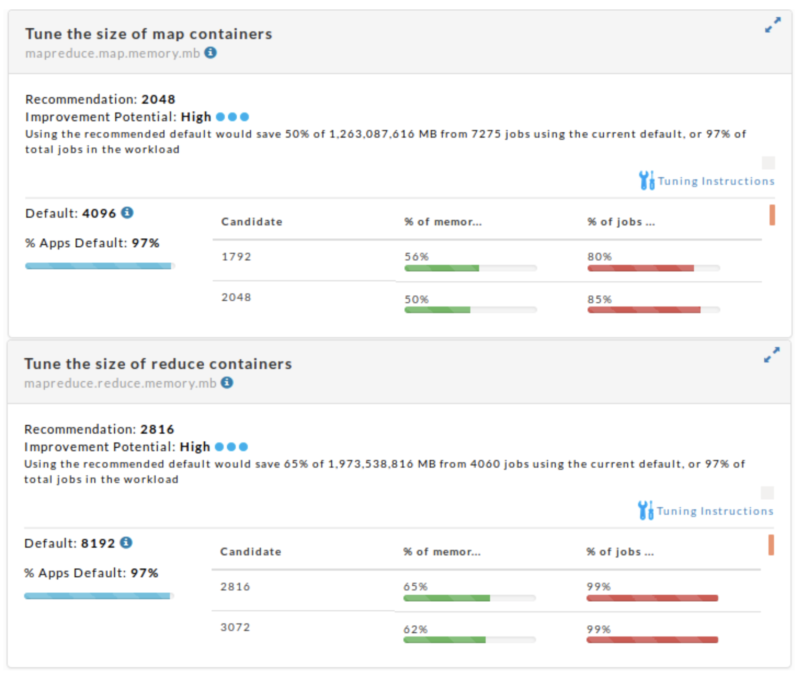
Figure Y1: Example set of cluster-wide recommendations
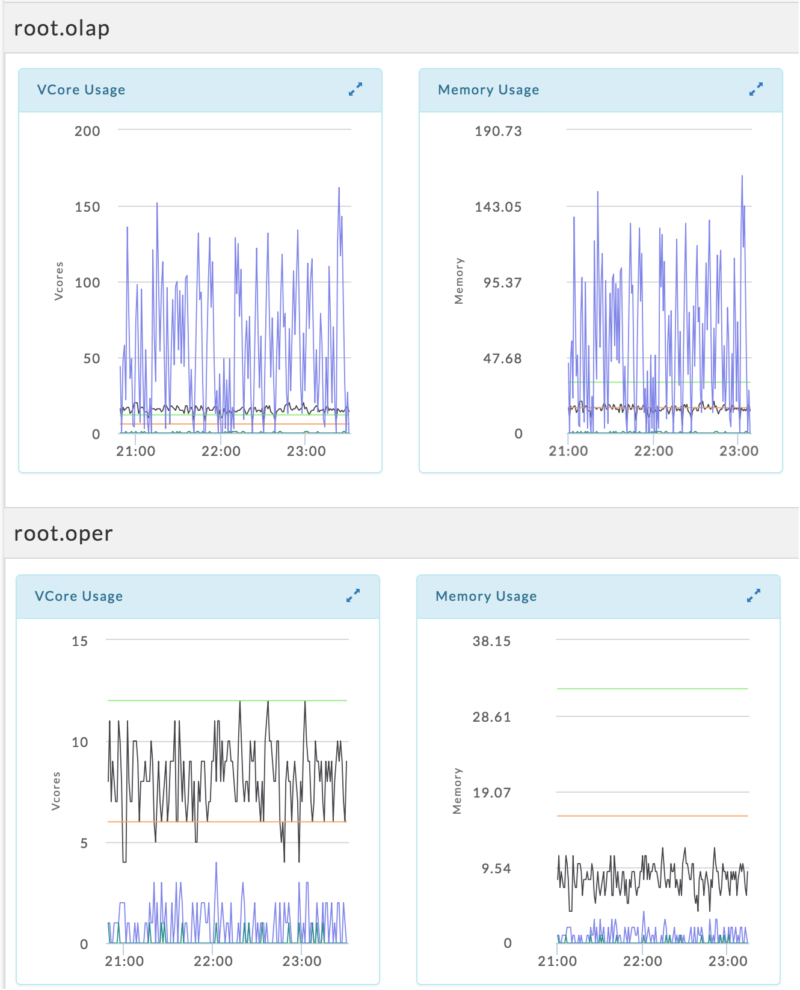
Figure Y2: Workload analysis
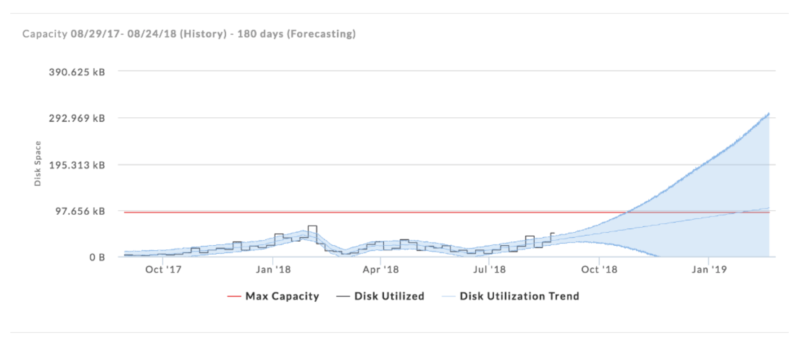
Figure Y3: Disk capacity forecasting
Solving the Biggest Big Data Challenges
Modern data applications face a number of unique performance management challenges. These challenges exist at the individual application level, as well as at the workload and cluster levels. To solve these problems at every level, a performance management solution needs to offer a range of capabilities to tell users why apps fail and enable them to optimize entire clusters. As organizations look to get more and more out of their modern data stack—including the use of artificial intelligence and machine learning—it’s imperative that they can address these common issues.
For more technical details, we refer the interested reader to our research paper to be presented at the biennial Conference on Innovative Data Systems Research (CIDR 2019).