

Table of Contents
Over the coming few weeks, we’ll provide some practical technical insights and advice on typical problems we encounter in working with many complex data pipelines. In this blog, we’ll talk about multi-tenant cluster contention issues. Check back in for future topics.
Modern data clusters are becoming increasingly commonplace and essential to your business. However, a wide variety of workloads typically run on a single cluster, making it a nightmare to manage and operate, similar to managing traffic in a busy city. We feel the pain of the operations folks out there who have to manage Spark, Hive, Impala, and Kafka apps running on the same cluster where they have to worry about each app’s resource requirements, the time distribution of the cluster workloads, the priority levels of each app or user, and then make sure everything runs like a predictable well-oiled machine.
We at Unravel have a unique perspective on this kind of thorny problem since we spend countless hours, day in and day out, studying the behavior of giant production clusters in the discovery of insights into how to improve performance, predictability, and stability whether it is a thousand node Hadoop cluster running batch jobs, or a five hundred node Spark cluster running AI, ML or some advanced, real-time, analytics. Or, more likely, 1000 nodes of Hadoop, connected via a 50 node Kafka cluster to a 500 node Spark cluster for processing. What could go wrong?
As you are most likely painfully well aware, plenty! Here are some of the most common problems that we see in the field:
- Oversubscribed clusters – too many apps or jobs to run, just not enough resources
- Bad container sizing – too big or too small
- Poor queue management – sizes of queues are inappropriate
- Resource hogging users or apps – bad apples in the cluster
So how do you go about solving each of these issues?
Measure and Analyze
To understand which of the above issues is plaguing your cluster, you must first understand what’s happening under the hood. Modern data clusters have several precious resources that the operations team must constantly watch. These include Memory, CPU, NameNode. When monitoring these resources, make sure to measure both the total available and consumed at any given time.
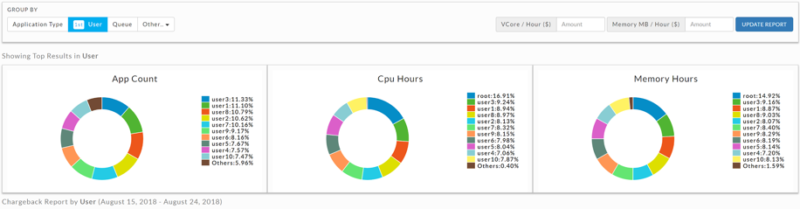
Next, break down these resource charts by user, app, department, project to truly understand who contributes how much to the total usage. This kind of analytical exploration can help quickly reveal:
- If there is anyone tenant (user, app, dept, project) causing the majority of users of the cluster, which may then require further investigation to determine if that tenant is using or abusing resources
- Which resources are under constant threat of being oversubscribed
- If you need to expand your big data cluster or tune apps and system to get more juice
Make apps better for multi-tenant citizens
Configuration settings at the cluster and app level dictate how many system resources each app gets. For example, if we have a setting of 8GB containers at the master level, then each app will get 8GB containers whether they need it or not. Now imagine if most of your apps only needed 4GB containers. Well, your system would show it’s at max capacity when it could be running twice as many apps.
In addition to inefficient memory sizing, big data apps can be bad multi-tenant citizens due to other bad configuration settings (CPU, # of containers, heap size, etc., etc. ), inefficient code, and bad data layout.
Therefore it’s crucial to measure and understand each of these resource-hogging factors for every app on the system and ensure they are using and not abusing resources.
Define queues and priority levels
Your big data cluster must have a resource management tool built-in, for example, YARN or Kubernetes. These tools allow you to divide your cluster into queues. This feature can work well to separate production workloads from experiments or Spark from HBase or high priority users from low priority ones, etc. The trick, though, is to get the levels of these queues right.
This is where “measure and analyze” techniques help again. You should analyze the usage of system resources by users, departments, or any other tenant you see fit to determine the min, max, average that they usually demand. This will get you some common sense levels for your queues.
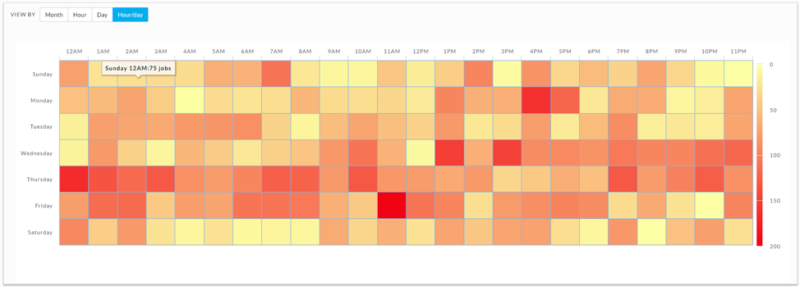
However, queue levels may need to be adjusted dynamically for best results. For example, a mission-critical app may need more resources if it processes 5x more data one day compared to the other. Therefore having a sense of seasonality is also essential when allocating these levels. A heatmap of cluster usage (as shown below) will enable us to get more precise about these allocations.
Proactively find and fix rogue users or apps.
Even after you follow the steps above, your cluster will experience rogue usage from time to time. Rogue usage is defined as bad behavior on the cluster by an application or user, such as hogging resources from a mission-critical app, taking more CPU or memory than needed for timely execution, having a very long idle shell, etc. In a multi-tenant environment, this type of behavior affects all users and ultimately reduces the reliability of the overall platform.
Therefore setting boundaries for acceptable behavior is very important to keep your big data cluster humming. A few examples of these are:
- The time limit for application execution
- CPU, memory, containers limit for each application or user
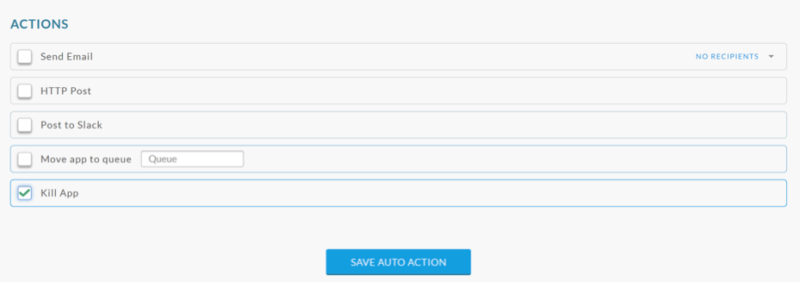
Setting the thresholds for these boundaries should be done after analyzing your cluster patterns over a month to help determine the average or accepted values. These values may also be different for different days of the week. Also, think about what happens when these boundaries are breached? Should the user and admin get an alert? Should these rogue applications be killed or moved to a lower priority queue?
Let us know if this was helpful or topics you would like us to address in future postings. Then, check back in for the next issue, which will be on the subject of rogue applications.